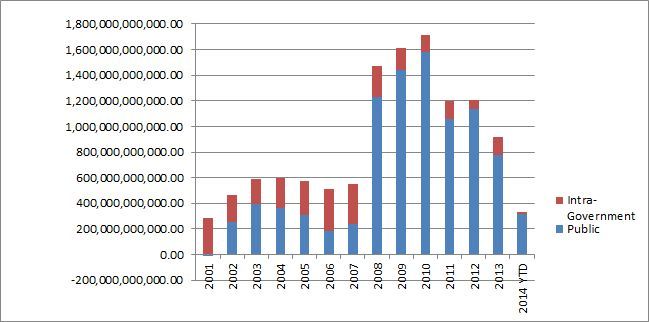
US Debt on a Calendar Year basis
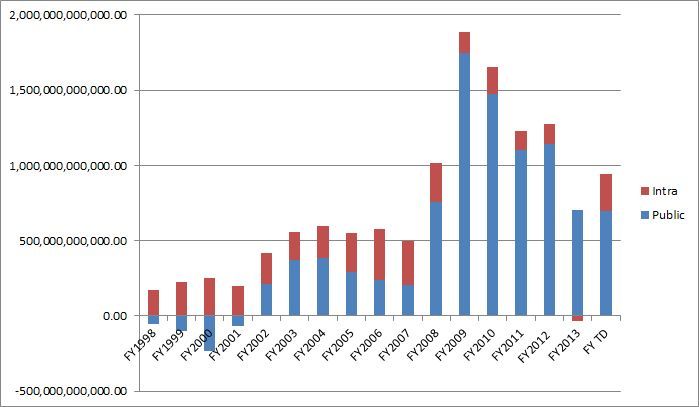
US Debt on a Fiscal Year Basis
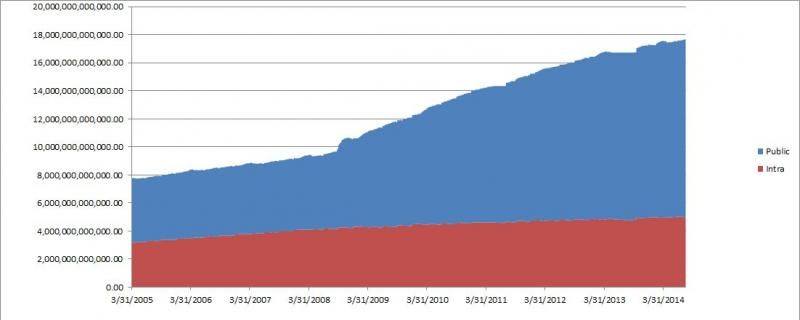
US Debt as running total
Day to Day Change in US Debt ( can you spot the "shutdown"?) - basically the derivative of the Total debt curve...
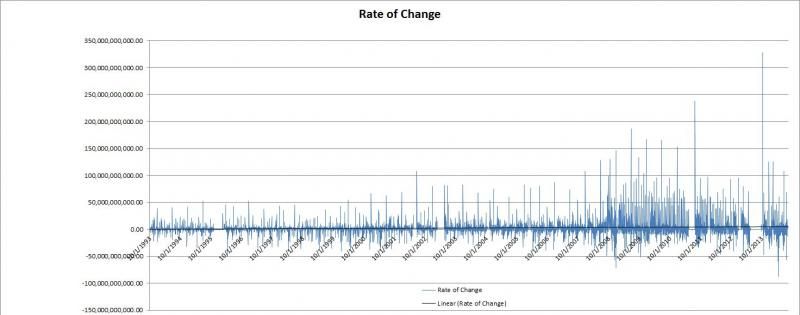
I think this last one is most interesting, because you can see the pattern of spending change.. higher, sudden spikes in or out vs. a steady day to day, some money comes in, some money goes out, but they are about even. That is obviously NOT how the Obama administration works. I think this is what cooked books look like, as they shuffle monye around at the last second to make things look right.
It does appear that the Obama growth rate overall is declining-- heading more towards the Bush trend-line (and remember - BUSH was bad and accounted for over 5 trillion in debt during his two terms..) but I don't think we have seen the full impact of Obamacare yet. Soon we will see huge government payouts to the Insurance companies to keep them solvent- their guaranteed profits during the death spiral, and of course a huge amount of money paid out in subsidies for coverage. Of course, they simply could be lying, and the debt numbers are much, much larger.. or this could be the effect of the
TARP wad of about 420 Billion being "paid back" making it look as if we aren't hemorrhaging quite as quickly. Of course being "paid back" just means the banks took out loans at 0.0001% interest form the Fed and gave them to the Treasury.. and with the sale of AIG stock (also artificially inflated by means of the Federal Reserve QE programs) means the government has collected more money from TARP than it paid out.. even with the housing money never having been paid back.. They have formed for themselves a new source of laundered revenue.. they own "troubled assets", so all they have to do is artificially inflate the prices on those assets via inflation and sell them and now they have "mo' money"