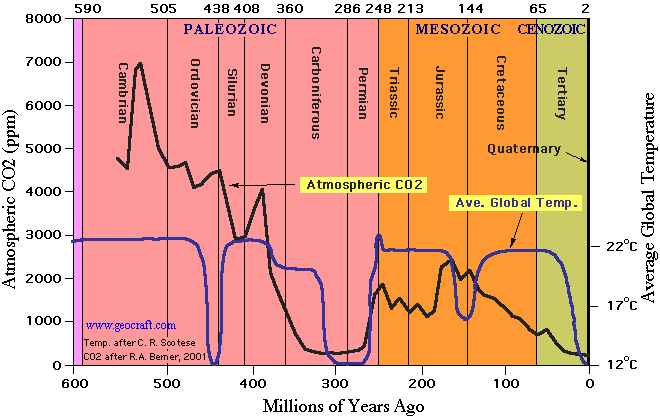
As you can see, a CO2 concentration of more than 300 ppm will immediately result in catastrophic warming and annihilation of life on the planet.
Source:
http://www.geocraft.com/WVFossils/Carboniferous_climate.htmlI have noticed that most liberals can't even explain the theory behind AGW. They believe it because a "bunch" of "scientists" have told them so. Way to go free-thinkers - falling for the appeal to authority fallacy. . And the majority of scientists and experts of Copurnicus' time would have told you what about the Sun? That it orbited the Earth? Do you think reality was up for a vote, an commonly held belief be can't be wrong? Come here, I have a black swan I want to show you.
http://www.ucar.edu/communications/newsreleases/2003/wigley2.htmlIt says : “The group found a warming trend of 0.16°F per decade in the layer between about 1.5 and 7.5 miles high, compared to a trend of 0.02°F in the previously published UAH analysis. Both estimates have a margin of error of nearly 0.2°F (plus or minus). According to the authors, the new results are a closer match with surface warming, as well as with four computer-model simulations of 20th-century climate produced by NCAR and Los Alamos National Laboratory”
So our trend is .16, and the margin of error is .2! That means that we can not even be sure of the sign of the change-- it could be -.04 degrees per decade! So this proves absolutely and without a doubt that there might possibly be some justification for thinking the planet is warming. These measurements suggest global warming is occurring because the majority of the error bar is above 0, but the fundamental point here is that satellite measurements (the most accurate we have) show a change of temperature that is still lost in the noise of our instrumentation. However, proponents of Global Warming are ready to declare that 100% of this .16 degree change are caused by Human interaction with the environment, despite the fact that the earth has been warming for that last 20,000 years.
If you haven't seen it there is an excellent video at climate-skeptic.com explaining the parts of the science that are just loony-tunes.
Basically it all hinges around the IPCC's concept of feedback, but touches on other areas such as CO2 saturation, bad statistics, bad data collection that the other problems with the science that Liberals won't admit are there, but expect you to ignore because smart people they agree with said so.
http://www.climate-skeptic.com/2010/01/catastrophe-denied-the-science-of-the-skeptics-position.html